
← Selected work · All case studies · How I work
A quieter invitation to sign in
A smaller invitation improved reported sign-in and sign-up rates and was dismissed less often than a modal. The tooltip was implemented in production.
My role: Led the Digital Optimization Team’s experimentation program. The comparison and readout below were shared team work.
The team: A DOT experiment with Product, UX, Design, Development, and Analytics.
The test brief
The problem: An earlier sign-in experience increased sign-in but was too intrusive. The team needed a less disruptive invitation.
The proposed solution (solution hypothesis): A tooltip could support sign-in and sign-up while demanding less attention than a modal.
The primary success metric: Sign-in and sign-up rates were the documented primary measures.
The secondary success metric: Incremental revenue.
Supporting measures: Dismissal rate and downstream shopping behavior, to check how guests responded to the invitation and whether it disrupted the purchase journey.
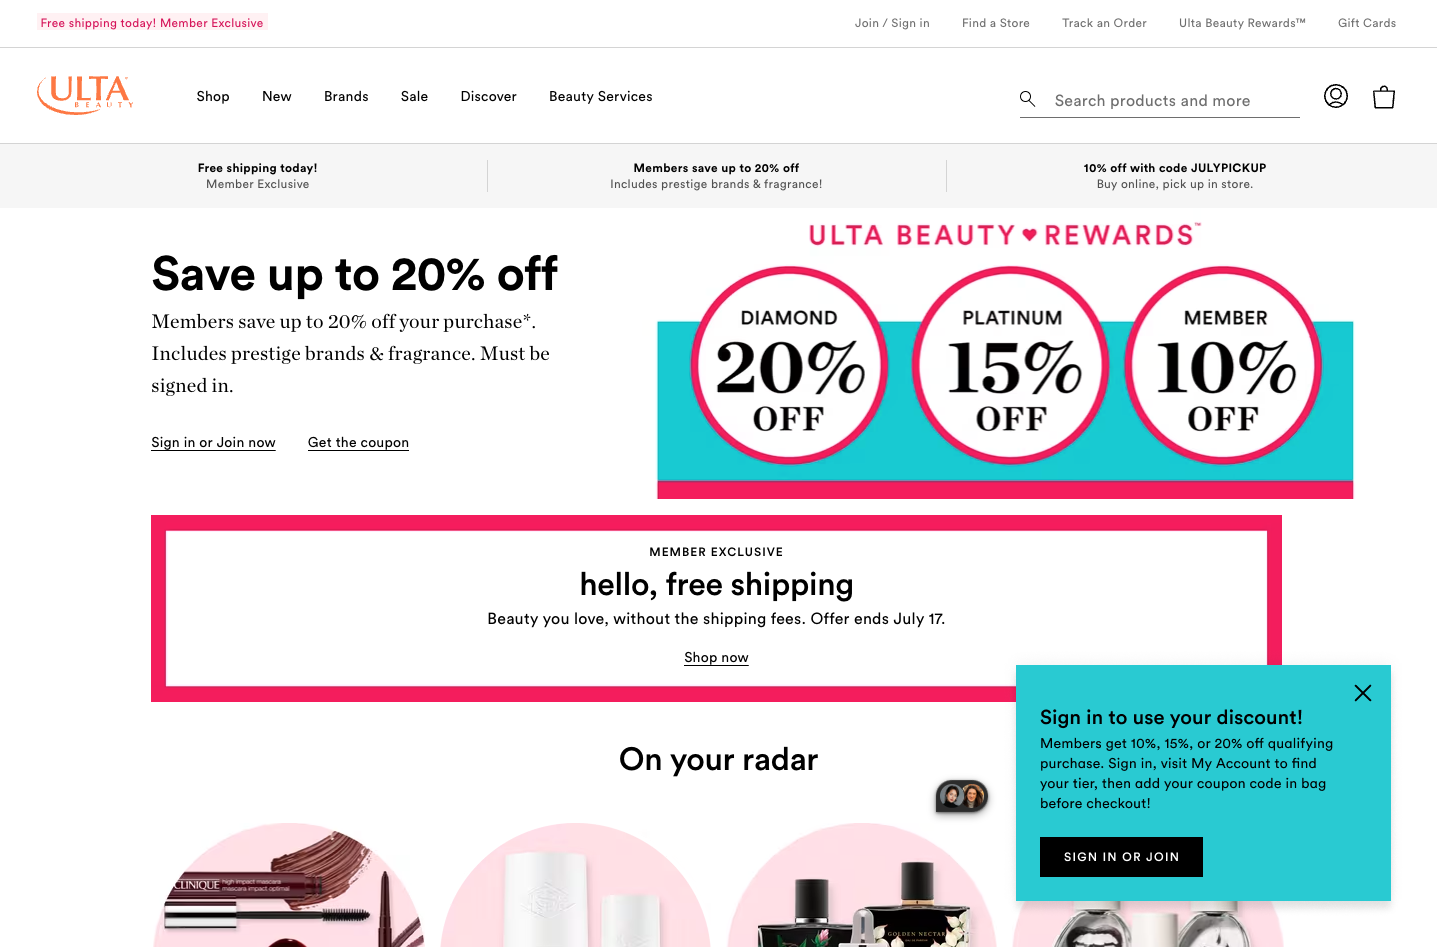
Modal alternative: a prominent sign-in message overlays the shopping page. Original Ulta Beauty experiment screenshot; created with our Product, UX, Design, Development, and Analytics partners.
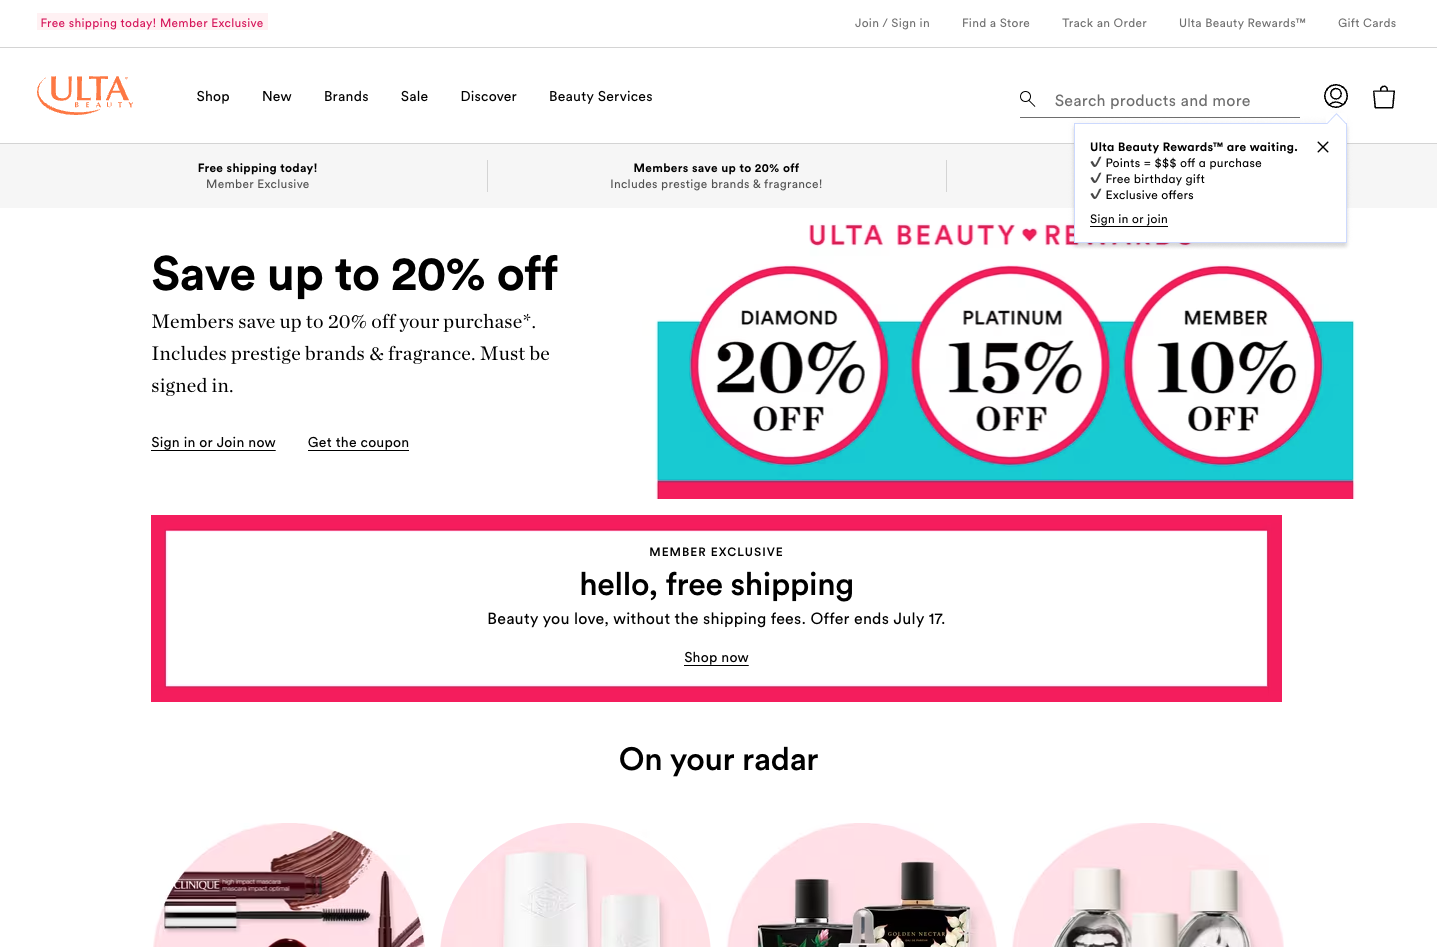
Tooltip alternative: a smaller invitation sits beneath the account icon, leaving more of the shopping page visible. The test asked whether we could support sign-in with less interruption.
The full story
Why another iteration was needed
An earlier sign-in test had increased sign-in but was considered too intrusive. The next question was more precise: could a less demanding invitation support account activity while fitting more comfortably into the shopping experience?
Give the alternatives a fair comparison
The T1503 test ran June 20–July 4, 2024, comparing a control, a modal, and a tooltip with roughly equal traffic allocations. Sign-in and sign-up rates were the primary measures; incremental revenue was secondary. Dismissals and downstream shopping measures added context about the experience around those actions.
Read the invitation as well as the response
Across mobile web and desktop combined, the tooltip increased sign-in rate by 8.56% and sign-up rate by 18.83% relative to control. The dismissal rate was 24.3% for the tooltip versus 41.6% for the modal—a difference of 17.3 percentage points. That made dismissal behavior useful alongside the primary goals: it helped describe how guests responded to the form of the invitation.
Revenue increased by a reported 0.70%, at 67% reported confidence. I treat that revenue result as directional rather than a conclusive commercial win.
Following the readout’s recommendation, the tooltip was implemented in production. The readout also called for ongoing monitoring and qualitative research into guests’ needs and expectations around signing in.
The next questions were experiential
The readout asked when signing in feels relevant, why guests choose to do it, and how long they expect to remain signed in. Those questions could explain the quantitative pattern and inform an iteration with a better understanding of guest intent.