
Turning guest feedback into a decision
At Ulta Beauty, I led the Digital Optimization Team. We tested changes to the website and app and used customer feedback to work out where to focus next. Sometimes that meant looking more closely at an experience we had already built.
One example was our 21 Days of Beauty event page. Scroll-depth data gave our UX and UI colleagues a reason to revisit its navigation and helped them make the case for a redesign that leadership approved.
My role: Led the team responsible for A/B and multivariate testing and helped share research findings and experiment results across the digital organization.
Partners: UX and UI colleagues developed the designs. Product managers prioritized improvements. Quantum Metric provided the analytics and session-replay platform, integrated with our Medallia guest survey.
Put the comment back in context
Our website and app had undergone a substantial replatforming and redesign. We needed to understand how those new experiences were working for guests.
Our always-on Medallia survey gave guests a way to tell us. From a comment, we could click through to the corresponding Quantum Metric session replay and see what had happened. We could then quantify similar experiences to understand how many other guests were running into the same problem.
Only 17% reached the bottom
We examined click maps, heat maps, and scroll depth for our major-event page templates, including 21 Days of Beauty. Only 17% of visitors were reaching the bottom of the page. There was quite a bit down there that most people weren’t seeing.
Our UX and UI colleagues redesigned the page to make it easier to navigate and presented the work to leadership with the supporting findings. The design was approved; as of March 2023, implementation and further measurement were still ahead.
Give the findings somewhere to go
We shared findings through Teams conversations, weekly discovery and review meetings with leadership, and email to the wider team. UX and UI colleagues cited the research behind their designs, so the reasoning traveled with the work.
My team shared A/B-test results openly, including winners and opportunities. Winning experiences went to product managers for prioritization. Product managers also used custom dashboards and opportunity-cost estimates to explain their roadmap decisions.
A wider use for session replay
Our previous recording tool had been used mainly by guest services to investigate individual problems. With Quantum Metric, more teams could examine recurring errors and interaction patterns, quantify their impact, and use that evidence to guide improvements. Session replay became part of our ongoing work on the experience, rather than something we reached for only when it broke.
A conversation before the game
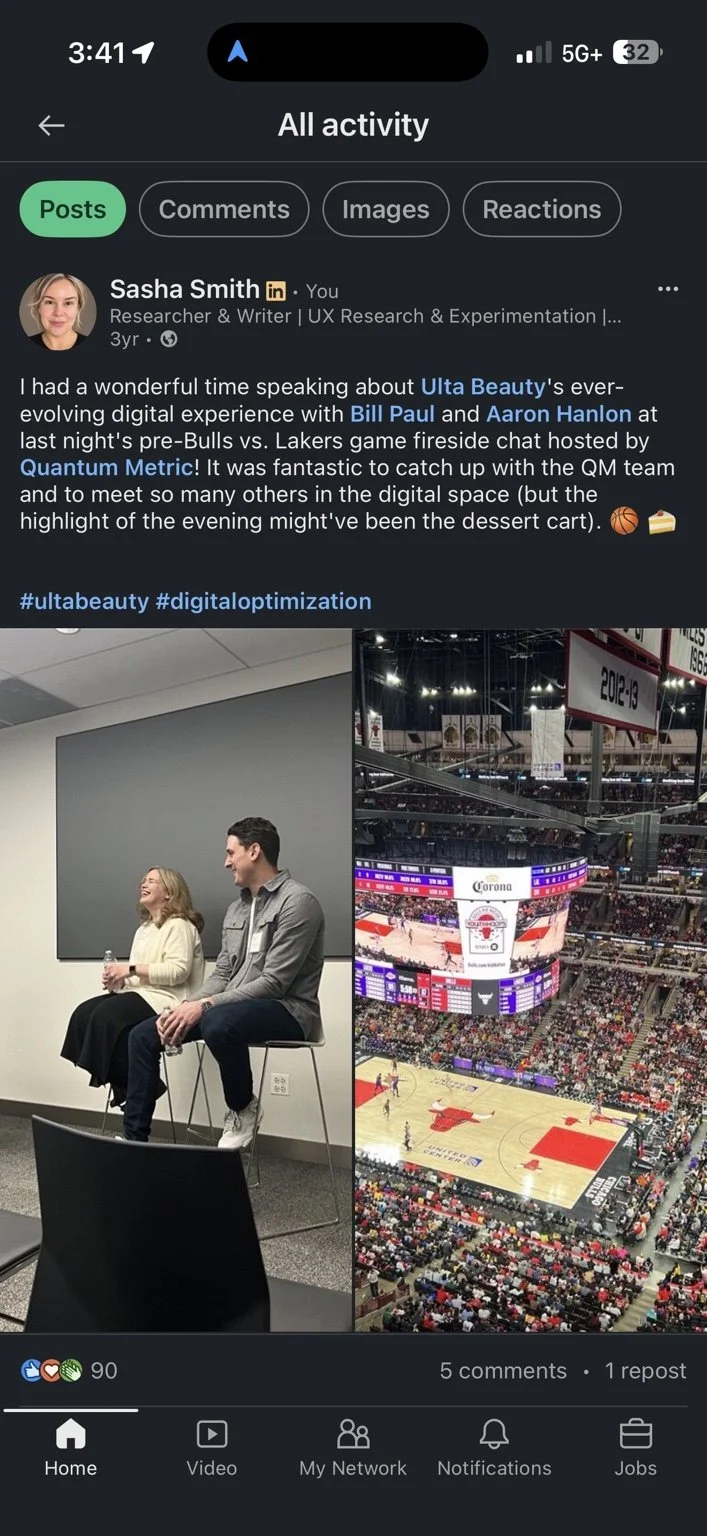
On March 29, 2023, I joined Bill Paul, regional VP of sales at Quantum Metric, and Aaron Hanlon, director of customer engineering at Google Cloud, for a fireside chat about this work. Quantum Metric hosted The Suite Spot: Chicago Bulls at the United Center. Afterward, we watched the Bulls–Lakers game from a box suite. It was lovely to catch up with the team and meet others in the digital community, although the dessert cart may have been the highlight.
Home / Work / Case studies / Quantum Metric
Turning guest feedback into a decision
A guest’s comment can tell you that something went wrong. Watching the session can show you what happened. Understanding how many other guests encountered it helps you decide what to do next.
At Ulta Beauty, we connected those kinds of evidence to guide improvements across our website and app. In one example, scroll-depth data informed a redesign of our 21 Days of Beauty event page. Leadership approved the design; implementation and measurement were still ahead when I prepared for a Quantum Metric fireside chat in March 2023.
My role: I led the digital optimization team, which owned A/B and multivariate testing, and helped share insights and experiment results across the digital organization. I represented that work at a Quantum Metric event on March 29, 2023.
Partners: UX and UI colleagues developed designs informed by the findings. Product managers used evidence to prioritize their roadmaps. Quantum Metric supplied the analytics and session-replay platform, integrated with our Medallia guest survey.
Put the comment back in context
Our website and app had undergone a substantial replatforming and redesign. We needed to understand how the new experiences were working for guests and where they were falling short.
An always-on Medallia survey gave guests a way to tell us. Its integration with Quantum Metric let us move from a comment to the corresponding session replay. Instead of guessing what a guest meant, we could watch the sequence of events around the problem.
Then we could quantify similar experiences. That combination gave us both a specific account of the difficulty and a way to judge its scale when prioritizing fixes and enhancements.
A page people weren’t reaching the bottom of
We used interaction data, including click maps, heat maps, and scroll depth, to examine page usability. For our major-event templates, including 21 Days of Beauty, we found that only 17% of visitors were reaching the bottom of the page.
That finding gave us a reason to revisit navigation. It did not, by itself, tell us why every visitor stopped scrolling or prove that a particular design would perform better.
Our UX and UI colleagues developed a redesign and presented it to leadership with the supporting findings. The design was approved. At the time of my practice recording, we were looking ahead to implementation and continued measurement; I do not have a verified post-launch conversion result to report here.
Give the findings somewhere to go
Evidence needed a route into decisions. We shared insights through Teams conversations, weekly discovery and review meetings with leadership, and email to the wider team. UX and UI colleagues cited the research behind their designs.
My team shared A/B-test results openly, including both winners and opportunities. Winning experiences went to product managers for prioritization. Product managers also used custom dashboards and opportunity-cost estimates to make the case for roadmap decisions.
The channels mattered because different colleagues needed the findings at different moments: while exploring a problem, reviewing a design, or deciding what to build next.
From reacting to improving
Previously, session recordings had been used mainly by guest services to investigate individual problems. Quantum Metric supported a broader practice: investigating errors, identifying repeated struggle, examining interaction patterns, and using those findings to guide improvements.
The useful change was the connection between methods and teams. A comment, a replay, an aggregate pattern, and an experiment each answered a different question. Together, they gave us a better basis for deciding where to put our effort.
A conversation before the game
I discussed Ulta Beauty’s evolving digital experience with Bill Paul and Aaron Hanlon at a Quantum Metric fireside chat before the Bulls–Lakers game on March 29, 2023. It was a chance to explain how guest insight informed the work—and to catch up with people across the digital community. The dessert cart also deserved its own mention.
Source note: This account draws on my practice-session recording for the March 2023 event and my contemporaneous LinkedIn post. The recording documents my prepared account, not a verbatim record of the delivered conversation. The 17% figure is a reported observation, not a measured improvement.
Keep exploring
Making experimentation a way of working