
← Selected work · All case studies · How I work
When fewer clicks asked a better question
A compact row of product recommendations got fewer clicks. Shoppers used search and the product grid more instead, giving us a better question for the next study.
My role: Led the Digital Optimization Team (DOT) and communicated the findings.
Team: Product sponsors, with design, development, and analysis contributed by the team.
The test brief
The problem: Product rails occupied substantial space on discovery pages. Could guests browse and interact with products more easily in a compact layout?
The proposed solution (solution hypothesis): Reduce visual clutter, emphasize product images, and bring more products into view so customers could identify an item more easily, open its details, or add it to their bag.
The primary success metric: Product-rail engagement.
The secondary success metric: Overall page engagement, including clicks to rails, subcategories, guided search, and the product grid.
Tertiary metric: Revenue per unique visitor.
Supporting diagnostic measures: Guided-search and product-grid interaction. These help explain where guests went when rail engagement declined.
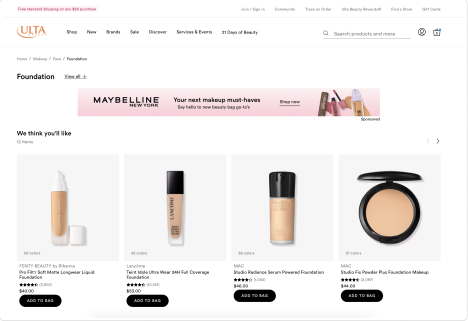
Control A: the original desktop product rail, with larger product cards. Original T2011 comparison from our compact-rail test series; the work reflects collaboration across Product, UX, Design, Development, and Analytics.
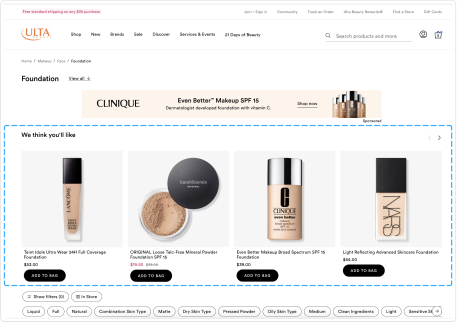
Variant B: an alternative compact desktop rail from the same T2011 comparison. We evaluated rail engagement alongside the rest of the shopping journey.
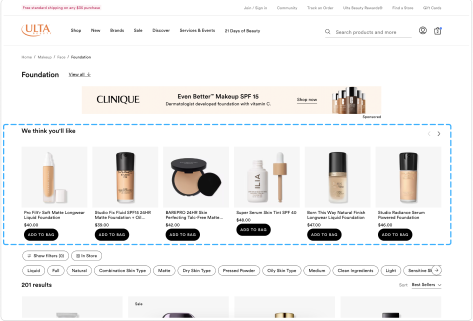
Variant C: another compact desktop rail from T2011. Lower rail engagement prompted us to look at where guests went next, including guided search and the product grid.
The full story
A reasonable hypothesis
The idea had strong stakeholder support. We explored the compact layout across several page types and devices.
I had learned to keep my own expectations provisional. After enough surprising tests, a plausible idea was still something to investigate. I often compared drawing conclusions too early to calling a football game in the first quarter—with the disclaimer that I am not a sports fan.
Look beyond the component
Desktop and mobile produced different patterns. Visibility and scroll depth affected whether guests encountered a rail at all, and one version exposed a small-screen quality assurance (QA) issue.
In the T2011 readout, the compact rail (Variant C) reduced rail engagement by 35.29% relative to control. Overall page engagement increased by 0.16%, with guided-search interaction up 11.24% and product-grid clicks up 6.32%. Revenue per unique visitor increased by 2.03%. These are reported relative changes across mobile web and desktop combined. The original expectation of more rail interaction had not been met.
Our readout raised the possibility that the smaller rail helped people move on more quickly. But fewer clicks on our component did not tell us, on their own, whether we had made shopping easier.
The lower engagement was the big surprise. We also considered whether the product images had become too small to catch someone’s eye or make an item easy to recognize. That was another explanation to test.
Give the next study a sharper question
The readout recommended qualitative research and further testing by shopping intent, including replenishment versus discovery, alongside stronger QA and design-development handoffs. What were guests looking for, where did they expect to find it, and when did a rail help?
We planned a follow-up test with larger product images. I left the organization around that time, so I can describe the next test we planned, but not its outcome.